
SRE & toil reduction Notes
If you do manage to create an experience that is 100% reliable for your customers and you want to maintain that level of reliability, you can never update or improve your service. The number one source of outages is change: pushing new features, applying security patches, deploying new hardware, and scaling up to meet customer demand will impact that 100% target
What to Measure: Using SLIs
we generally recommend treating the SLI as the ratio of two numbers: the number of good events divided by the total number of events.
- Number of successful HTTP requests / total HTTP requests (success rate)
- Number of gRPC calls that completed successfully in < 100 ms / total gRPC requests
- Number of search results that used the entire corpus / total number of search results, including those that degraded gracefully
- Number of “stock check count” requests from product searches that used stock data fresher than 10 minutes / total number of stock check requests
- Number of “good user minutes” according to some extended list of criteria for that metric / total number of user minutes
Chapter 2. Implementing SLOs
By Steven Thurgood and David Ferguson
with Alex Hidalgo and Betsy Beyer
Service level objectives (SLOs) specify a target level for the reliability of your service. Because SLOs are key to making data-driven decisions about reliability, they’re at the core of SRE practices. In many ways, this is the most important chapter in this book.
Once you’re equipped with a few guidelines, setting up initial SLOs and a process for refining them can be straightforward. Chapter 4 in our first book introduced the topic of SLOs and SLIs (service level indicators), and gave some advice on how to use them.
After discussing the motivation behind SLOs and error budgets, this chapter provides a step-by-step recipe to get you started thinking about SLOs, and also some advice about how to iterate from there. We’ll then cover how to use SLOs to make effective business decisions, and explore some advanced topics. Finally, we’ll give you some examples of SLOs for different types of services and some pointers on how to create more sophisticated SLOs in specific situations.1
Why SREs Need SLOs
Engineers are a scarce resource at even the largest organizations. Engineering time should be invested in the most important characteristics of the most important services. Striking the right balance between investing in functionality that will win new customers or retain current ones, versus investing in the reliability and scalability that will keep those customers happy, is difficult. At Google, we’ve learned that a well-thought-out and adopted SLO is key to making data-informed decisions about the opportunity cost of reliability work, and to determining how to appropriately prioritize that work.
SREs’ core responsibilities aren’t merely to automate “all the things” and hold the pager. Their day-to-day tasks and projects are driven by SLOs: ensuring that SLOs are defended in the short term and that they can be maintained in the medium to long term. One could even claim that without SLOs, there is no need for SREs.
SLOs are a tool to help determine what engineering work to prioritize. For example, consider the engineering tradeoffs for two reliability projects: automating rollbacks and moving to a replicated data store. By calculating the estimated impact on our error budget, we can determine which project is most beneficial to our users. See the section “Decision Making Using SLOs and Error Budgets” for more detail on this, and “Managing Risk” in Site Reliability Engineering.
Getting Started
As a starting point for establishing a basic set of SLOs, let’s assume that your service is some form of code that has been compiled and released and is running on networked infrastructure that users access via the web. Your system’s maturity level might be one of the following:
- A greenfield development, with nothing currently deployed
- A system in production with some monitoring to notify you when things go awry, but no formal objectives, no concept of an error budget, and an unspoken goal of 100% uptime
- A running deployment with an SLO below 100%, but without a common understanding about its importance or how to leverage it to make continuous improvement choices—in other words, an SLO without teeth
In order to adopt an error budget-based approach to Site Reliability Engineering, you need to reach a state where the following hold true:
- There are SLOs that all stakeholders in the organization have approved as being fit for the product.
- The people responsible for ensuring that the service meets its SLO have agreed that it is possible to meet this SLO under normal circumstances.
- The organization has committed to using the error budget for decision making and prioritizing. This commitment is formalized in an error budget policy.
- There is a process in place for refining the SLO.
Otherwise, you won’t be able to adopt an error budget–based approach to reliability. SLO compliance will simply be another KPI (key performance indicator) or reporting metric, rather than a decision-making tool.
Reliability Targets and Error Budgets
The first step in formulating appropriate SLOs is to talk about what an SLO should be, and what it should cover.
An SLO sets a target level of reliability for the service’s customers. Above this threshold, almost all users should be happy with your service (assuming they are otherwise happy with the utility of the service).2 Below this threshold, users are likely to start complaining or to stop using the service. Ultimately, user happiness is what matters—happy users use the service, generate revenue for your organization, place low demands on your customer support teams, and recommend the service to their friends. We keep our services reliable to keep our customers happy.
Customer happiness is a rather fuzzy concept; we can’t measure it precisely. Often we have very little visibility into it at all, so how do we begin? What do we use for our first SLO?
Our experience has shown that 100% reliability is the wrong target:
- If your SLO is aligned with customer satisfaction, 100% is not a reasonable goal. Even with redundant components, automated health checking, and fast failover, there is a nonzero probability that one or more components will fail simultaneously, resulting in less than 100% availability.
- Even if you could achieve 100% reliability within your system, your customers would not experience 100% reliability. The chain of systems between you and your customers is often long and complex, and any of these components can fail.3 This also means that as you go from 99% to 99.9% to 99.99% reliability, each extra nine comes at an increased cost, but the marginal utility to your customers steadily approaches zero.
- If you do manage to create an experience that is 100% reliable for your customers, and want to maintain that level of reliability, you can never update or improve your service. The number one source of outages is change: pushing new features, applying security patches, deploying new hardware, and scaling up to meet customer demand will impact that 100% target. Sooner or later, your service will stagnate and your customers will go elsewhere, which is not great for anyone’s bottom line.
- An SLO of 100% means you only have time to be reactive. You literally cannot do anything other than react to < 100% availability, which is guaranteed to happen. Reliability of 100% is not an engineering culture SLO—it’s an operations team SLO.
Once you have an SLO target below 100%, it needs to be owned by someone in the organization who is empowered to make tradeoffs between feature velocity and reliability. In a small organization, this may be the CTO; in larger organizations, this is normally the product owner (or product manager).
What to Measure: Using SLIs
Once you agree that 100% is the wrong number, how do you determine the right number? And what are you measuring, anyway? Here, service level indicators come into play: an SLI is an indicator of the level of service that you are providing.
While many numbers can function as an SLI, we generally recommend treating the SLI as the ratio of two numbers: the number of good events divided by the total number of events. For example:
- Number of successful HTTP requests / total HTTP requests (success rate)
- Number of gRPC calls that completed successfully in < 100 ms / total gRPC requests
- Number of search results that used the entire corpus / total number of search results, including those that degraded gracefully
- Number of “stock check count” requests from product searches that used stock data fresher than 10 minutes / total number of stock check requests
- Number of “good user minutes” according to some extended list of criteria for that metric / total number of user minutes
SLIs of this form have a couple of particularly useful properties. The SLI ranges from 0% to 100%, where 0% means nothing works, and 100% means nothing is broken. We have found this scale intuitive, and this style lends itself easily to the concept of an error budget: the SLO is a target percentage and the error budget is 100% minus the SLO. For example, if you have a 99.9% success ratio SLO, then a service that receives 3 million requests over a four-week period had a budget of 3,000 (0.1%) errors over that period. If a single outage is responsible for 1,500 errors, that error costs 50% of the error budget.4
In addition, making all of your SLIs follow a consistent style allows you to take better advantage of tooling: you can write alerting logic, SLO analysis tools, error budget calculation, and reports to expect the same inputs: numerator, denominator, and threshold. Simplification is a bonus here.
When attempting to formulate SLIs for the first time, you might find it useful to further divide SLIs into SLI specification and SLI implementation:SLI specification
The assessment of service outcome that you think matters to users, independent of how it is measured.
For example: Ratio of home page requests that loaded in < 100 msSLI implementation
The SLI specification and a way to measure it.
For example:
- Ratio of home page requests that loaded in < 100 ms, as measured from the Latency column of the server log. This measurement will miss requests that fail to reach the backend.
- Ratio of home page requests that loaded in < 100 ms, as measured by probers that execute JavaScript in a browser running in a virtual machine. This measurement will catch errors when requests cannot reach our network, but may miss issues that affect only a subset of users.
- Ratio of home page requests that loaded in < 100 ms, as measured by instrumentation in the JavaScript on the home page itself, and reported back to a dedicated telemetry recording service. This measurement will more accurately capture the user experience, although we now need to modify the code to capture this information and build the infrastructure to record it—a specification that has its own reliability requirements.
As you can see, a single SLI specification might have multiple SLI implementations, each with its own set of pros and cons in terms of quality (how accurately they capture the experience of a customer), coverage (how well they capture the experience of all customers), and cost.
Your first attempt at an SLI and SLO doesn’t have to be correct; the most important goal is to get something in place and measured, and to set up a feedback loop so you can improve. (We dive deeper into this topic in “Continuous Improvement of SLO Targets”.)
In our first book, we advise against picking an SLO based upon current performance, because this can commit you to unnecessarily strict SLOs. While that advice is true, your current performance can be a good place to start if you don’t have any other information, and if you have a good process for iterating in place (which we’ll cover later). However, don’t let current performance limit you as you refine your SLO: your customers will also come to expect your service to perform at its SLO, so if your service returns successful requests 99.999% of the time in less than 10 ms, any significant regression from that baseline may make them unhappy.
To create your first set of SLOs, you need to decide upon a few key SLI specifications that matter to your service. Availability and latency SLOs are pretty common; freshness, durability, correctness, quality, and coverage SLOs also have their place (we’ll talk more about those later).
If you are having trouble figuring out what sort of SLIs to start with, it helps to start simple:
- Choose one application for which you want to define SLOs. If your product comprises many applications, you can add those later.
- Decide clearly who the “users” are in this situation. These are the people whose happiness you are optimizing.
- Consider the common ways your users interact with your system—common tasks and critical activities.
- Draw a high-level architecture diagram of your system; show the key components, the request flow, the data flow, and the critical dependencies. Group these components into categories listed in the following section (there may be some overlap and ambiguity; use your intuition and don’t let perfect be the enemy of the good).
You should think carefully about exactly what you select as your SLIs, but you also shouldn’t overcomplicate things. Especially if you’re just starting your SLI journey, pick an aspect of your system that’s relevant but easy to measure—you can always iterate and refine it later.
Types of components
The easiest way to get started with setting SLIs is to abstract your system into a few common types of components. You can then use our list of suggested SLIs for each component to choose the ones most relevant to your service:
Request-driven
The user creates some type of event and expects a response. For example, this could be an HTTP service where the user interacts with a browser or an API for a mobile application. Pipeline
A system that takes records as input, mutates them and places the output somewhere else. This might be a simple process that runs on a single instance in real-time, or a multistage batch process that takes many hours. Examples include:
- A system that periodically reads data from a relational database and writes it into a distributed hash table for optimized serving
- A video processing service that converts video from one format to another
- A system that reads in log files from many sources to generate reports
- A monitoring system that pulls metrics from remote servers and generates time series and alerts
Storage
A system that accepts data (e.g., bytes, records, files, videos) and makes it available to be retrieved at a later date.
To summarize:
- SLOs are the tool by which you measure your service’s reliability.
- Error budgets are a tool for balancing reliability with other engineering work, and a great way to decide which projects will have the most impact.
- You should start using SLOs and error budgets today.
Desirable Features of a Monitoring Strategy
Speed
Data more than four to five minutes stale might significantly impact how quickly you can respond to an incident.
Calculations
Support for calculations can span a variety of use cases, across a range of complexities. At a minimum, you’ll probably want your system to retain data over a multimonth time frame. Without a long-term view of your data, you cannot analyze long-term trends like system growth.
Chapter 4. Monitoring
By Jess Frame, Anthony Lenton, Steven Thurgood,
Anton Tolchanov, and Nejc Trdin
with Carmela Quinito
Monitoring can include many types of data, including metrics, text logging, structured event logging, distributed tracing, and event introspection. While all of these approaches are useful in their own right, this chapter mostly addresses metrics and structured logging. In our experience, these two data sources are best suited to SRE’s fundamental monitoring needs.
At the most basic level, monitoring allows you to gain visibility into a system, which is a core requirement for judging service health and diagnosing your service when things go wrong. Chapter 6 in the first SRE book provides some basic monitoring definitions and explains that SREs monitor their systems in order to:
- Alert on conditions that require attention.
- Investigate and diagnose those issues.
- Display information about the system visually.
- Gain insight into trends in resource usage or service health for long-term planning.
- Compare the behavior of the system before and after a change, or between two groups in an experiment.
The relative importance of these use cases might lead you to make tradeoffs when selecting or building a monitoring system.
This chapter talks about how Google manages monitoring systems and provides some guidelines for questions that may arise when you’re choosing and running a monitoring system.
Desirable Features of a Monitoring Strategy
When choosing a monitoring system, it is important to understand and prioritize the features that matter to you. If you’re evaluating different monitoring systems, the attributes in this section can help guide your thinking about which solution(s) best suits your needs. If you already have a monitoring strategy, you might consider using some additional capabilities of your current solution. Depending on your needs, one monitoring system may address all of your use cases, or you may want to use a combination of systems.
Speed
Different organizations will have different needs when it comes to the freshness of data and the speed of data retrieval.
Data should be available when you need it: freshness impacts how long it will take your monitoring system to page you when something goes wrong. Additionally, slow data might lead you to accidentally act on incorrect data. For example, during incident response, if the time between cause (taking an action) and effect (seeing that action reflected in your monitoring) is too long, you might assume a change had no effect or deduce a false correlation between cause and effect. Data more than four to five minutes stale might significantly impact how quickly you can respond to an incident.
If you’re selecting a monitoring system based upon this criteria, you need to figure out your speed requirements ahead of time. Speed of data retrieval is mostly a problem when you’re querying vast amounts of data. It might take some time for a graph to load if it has to tally up a lot of data from many monitored systems. To speed up your slower graphs, it’s helpful if the monitoring system can create and store new time series based on incoming data; then it can precompute answers to common queries.
Calculations
Support for calculations can span a variety of use cases, across a range of complexities. At a minimum, you’ll probably want your system to retain data over a multimonth time frame. Without a long-term view of your data, you cannot analyze long-term trends like system growth. In terms of granularity, summary data (i.e., aggregated data that you can’t drill down into) is sufficient to facilitate growth planning. Retaining all detailed individual metrics may help with answering questions like, “Has this unusual behavior happened before?” However, the data might be expensive to store or impractical to retrieve.
The metrics you retain about events or resource consumption should ideally be monotonically incrementing counters. Using counters, your monitoring system can calculate windowed functions over time—for example, to report the rate of requests per second from that counter. Computing these rates over a longer window (up to a month) allows you to implement the building blocks for SLO burn-based alerting (see Chapter 5).
Finally, support for a more complete range of statistical functions can be useful because trivial operations may mask bad behavior. A monitoring system that supports computing percentiles (i.e., 50th, 95th, 99th percentiles) when recording latency will let you see if 50%, 5%, or 1% of your requests are too slow, whereas the arithmetic mean can only tell you—without specifics—that the request time is slower. Alternatively, if your system doesn’t support computing percentiles directly, you can achieve this by:
- Obtaining a mean value by summing the seconds spent in requests and dividing by the number of requests
- Logging every request and computing the percentile values by scanning or sampling the log entries
You might want to record your raw metric data in a separate system for offline analysis—for example, to use in weekly or monthly reports, or to perform more intricate calculations that are too difficult to compute in your monitoring system.
Interfaces
A robust monitoring system should allow you to concisely display time-series data in graphs, and also to structure data in tables or a range of chart styles. Your dashboards will be primary interfaces for displaying monitoring, so it’s important that you choose formats that most clearly display the data you care about. Some options include heatmaps, histograms, and logarithmic scale graphs.
Alerts
It’s helpful to be able to classify alerts: multiple categories of alerts allow for proportional responses.
Sources of Monitoring Data
Two common sources of monitoring data: logs and metrics.
Metrics are numerical measurements representing attributes and events, typically harvested via many data points at regular time intervals. Logs are an append-only record of events.
Google’s logs-based systems process large volumes of highly granular data. There’s some inherent delay between when an event occurs and when it is visible in logs. For analysis that’s not time-sensitive, these logs can be processed with a batch system, interrogated with ad hoc queries, and visualized with dashboards. An example of this workflow would be using Cloud Dataflow to process logs, BigQuery for ad hoc queries, and Data Studio for the dashboards.
By contrast, our metrics-based monitoring system, which collects a large number of metrics from every service at Google, provides much less granular information, but in near real-time. These characteristics are fairly typical of other logs- and metrics-based monitoring systems, although there are exceptions, such as real-time logs systems or high-cardinality metrics.
Toil Defined
Toil is the kind of work tied to running a production service that tends to be manual, repetitive, automatable, tactical, devoid of enduring value, and that scales linearly as a service grows. Not every task deemed toil has all these attributes, but the more closely work matches one or more of the following descriptions, the more likely it is to be toil:
Manual
This includes work such as manually running a script that automates some task. Running a script may be quicker than manually executing each step in the script, but the hands-on time a human spends running that script (not the elapsed time) is still toil time.
Repetitive
If you’re performing a task for the first time ever, or even the second time, this work is not toil. Toil is work you do over and over. If you’re solving a novel problem or inventing a new solution, this work is not toil.
Automatable
If a machine could accomplish the task just as well as a human, or the need for the task could be designed away, that task is toil. If human judgment is essential for the task, there’s a good chance it’s not toil.
Tactical
Toil is interrupt-driven and reactive, rather than strategy-driven and proactive. Handling pager alerts is toil. We may never be able to eliminate this type of work completely, but we have to continually work toward minimizing it.
No enduring value
If your service remains in the same state after you have finished a task, the task was probably toil. If the task produced a permanent improvement in your service, it probably wasn’t toil, even if some amount of grunt work—such as digging into legacy code and configurations and straightening them out—was involved.
O(n) with service growth
If the work involved in a task scales up linearly with service size, traffic volume, or user count, that task is probably toil. An ideally managed and designed service can grow by at least one order of magnitude with zero additional work, other than some one-time efforts to add resources.
What Qualifies as Engineering?
Engineering work is novel and intrinsically requires human judgment. It produces a permanent improvement in your service, and is guided by a strategy. It is frequently creative and innovative, taking a design-driven approach to solving a problem—the more generalized, the better. Engineering work helps your team or the SRE organization handle a larger service, or more services, with the same level of staffing.
Typical SRE activities fall into the following approximate categories:
Software engineering
Involves writing or modifying code, in addition to any associated design and documentation work. Examples include writing automation scripts, creating tools or frameworks, adding service features for scalability and reliability, or modifying infrastructure code to make it more robust.
Systems engineering
Involves configuring production systems, modifying configurations, or documenting systems in a way that produces lasting improvements from a one-time effort. Examples include monitoring setup and updates, load balancing configuration, server configuration, tuning of OS parameters, and load balancer setup. Systems engineering also includes consulting on architecture, design, and productionization for developer teams.
Toil
Work directly tied to running a service that is repetitive, manual, etc.
Overhead
Administrative work not tied directly to running a service. Examples include hiring, HR paperwork, team/company meetings, bug queue hygiene, snippets, peer reviews and self-assessments, and training courses.
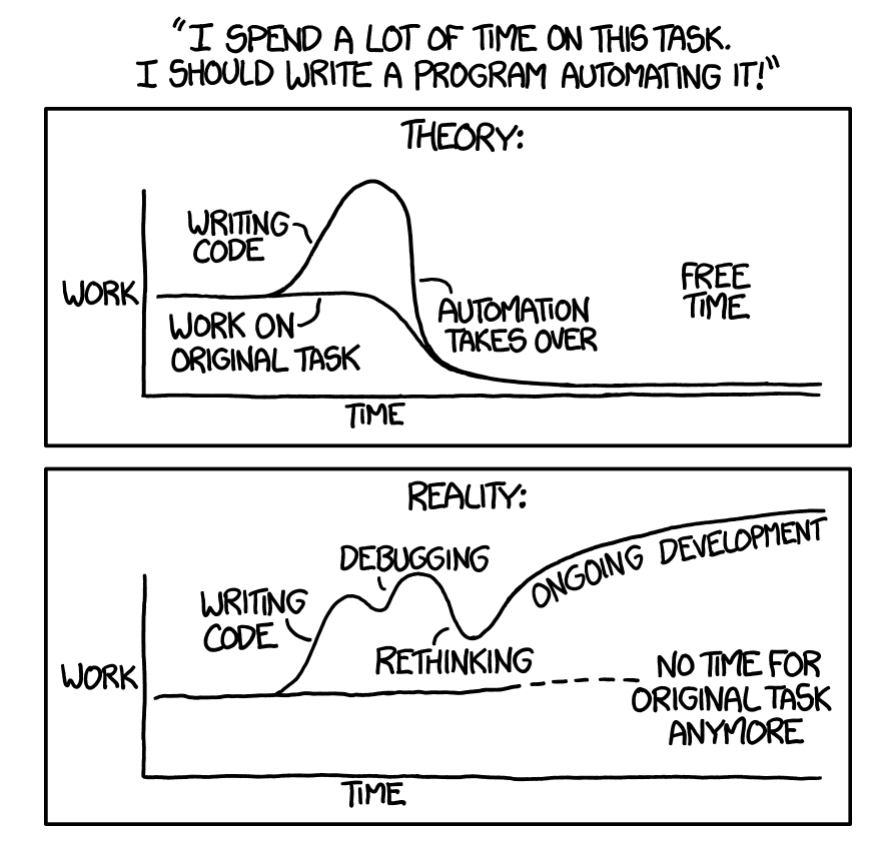
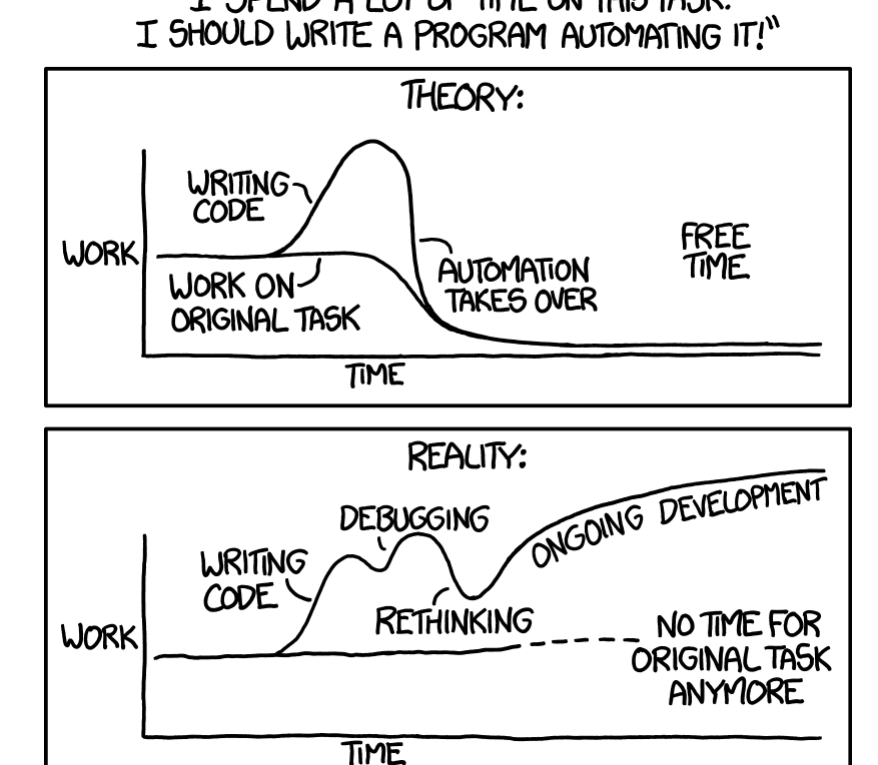
Eliminating Toil
Start with Human-Backed Interfaces that save you save you from overengineering a big-bang solution before you’ve fully mapped and understood the domain.
Frederick Alvarez
- Identify and Measure Toil
- Engineer Toil Out of the System
- Reject the Toil
- Use SLOs to Reduce Toil
- Start with Human-Backed Interfaces
- Provide Self-Service Methods
- Get Support from Management and Colleagues
- Promote Toil Reduction as a Feature
- Start Small and Then Improve
- Increase Uniformity
- Assess Risk Within Automation
- Automate Toil Response
- Use Open Source and Third-Party Tools
- Use Feedback to Improve